
Choosing a Broker

How to t.o.s.
Video Series on “How to T.O.S” and related links for the TOS WorkBook and the OEC Morning Briefing.

Websites and Apps
With so many companies now offering trade tools - it's often hard to keep up. In this post we will review some of the "go to" market tools I use daily.
This list is not complete - be sure to check back later for updates!

Questionable Exits
In this post we begin the discussion on exit tactics. When it comes to developing a consistent exit we have to understand what works best for the types of trades we are taking.
Where you trade and when you trade will directly impact the size of the stop you use. Read more about the exit concepts in this post.

Drop Base Rally
A follow-up post on the Drop Base Rally introduction; in this post we tie everything together; the DBR pattern to the "swing high" pattern to the Evening Star reversal pattern.
Read this post to connect the dots!

Support and Resistance
Support and Resistance are in the past; we can only see where price found support or was resisted. Anything on the right side of price is "potential support" or "potential resistance."
In this post we examine the concept of "swing high / swing low" and introduce DBR concepts for the first time.
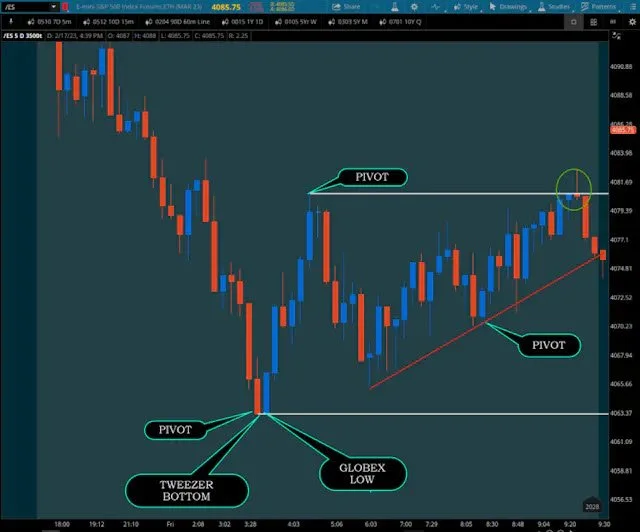
Pivots
Recognize the opportunity to trade today by developing analysis on the charts. Learn these concepts through repeated analysis of previous trading days.
Get good enough at applying these steps on previous days to begin the application within a developing trading day.

Apply Analysis
This post discusses some introduction techniques to trend lines and touches on Bid / Ask with Level II.
We all start somewhere in technical analysis - even with things like trend lines and trend analysis.

What Moves Markets
In this post we are going to discuss broadly - what is moving markets. This is going to be an expanding thread - one that we will add to over time.
Indexes, sectors, events, government, debit, corporations ... things that can drive our market or leave us chopping sideways are discussed in this post.

Liquidity Gap
Multiple times each month we have a possible Liquidity Gap trade setup. In this post we will discuss what the setup looks like and how we can use that large candle for analysis and trading.

Breadth
Market Breadth Tools are a great way to evaluate the strength of the market each day. In this post we examine these tools more closely and discuss their use.

Measuring Things II
Second post about using the drawing tool to define the current market structure and project the next possible turning point.
In this post - get more familiar with what we can measure and how we can measure it.

Top Down Analysis
As discussed in the Morning Briefing post - the Top Down analysis teaches us "where did we come from - where are we going" and holds us accountable.
This Top Down analysis helps you avoid intraday surprises.

Risk & Reward
Building a trading strategy is important to our success - and keeping track of our results shows us where we are improving or where we need to improve.
These results can even be used as conviction to begin live trading or it can remind us to stay in paper until the stats improve.

Journal Continues
This post continues the discussion on Journal Work - using examples from my own trading journal. These will hopefully inspire you to begin your own journal work.

Journal Introduction
Learning from our mistakes is one of the greatest things about journaling the trades we took; in this post we introduce the idea of Trading Journals and our approach to Journals at the OEC

Daily Strategy Introduction
Strategies for trading price action - are good for stocks, options and futures! This post discusses looking at the higher timeframe charts to evaluate and consider the intraday trading opportunity.

Intraday Strategy Introduction
Strategies are pre-planned trade setups that offer consistent outcomes.
While there is no 100% success rate to trading - strategies offer traders an approach that has a measurable success rate.
This post introduces a few intraday strategies that we love trading at the OEC

Consistency
Develop a set of charts for consistent analysis; in this introduction to consistent analysis post we lay out some of the common levels and consider how to approach them for trading.

Introduction to D.O.M
When trading Futures - you'll often hear people talk about "liquidity" in the markets and the DOM is a great way to see this.
While "VOLUME" looks at trades that already took place - the DOM shows us where traders are positioning - it's showing the available liquidity.