TICK
NYSE $TICK
Market Breadth is an “old school” quantitative analysis function designed to provide scope and perspective to today’s money flow; before we get into Cumulative TICK and how I believe it is useful to intraday traders we first have to understand what $TICK is. Per Investopedia, the $TICK index
“compares the number of stocks that are rising to the number of stocks that are falling on the New York Stock Exchange (NYSE).
The index measures stocks making an uptick and subtracts stocks making a downtick. For example, there are roughly 2,800 stocks listed on the NYSE. If 1,800 stocks have made an uptick and 1,000 stocks have made a downtick, the tick index would equal +800 (1,800 – 1,000).”
As with anything else – there are periods of time where $TICK is not useful but even within these times – the fact that $TICK is not providing us with insight – provides us with insight! For example, the intraday $TICK may be crossing the zero line frequently; this is an indication of a choppy market and provides a perspective suggesting the overall market is uncommitted. There are a number of patterns provided by the $TICK index we can utilize
Using the "Simple TICK" indicator on TOS
Extreme Readings
For the $TICK we can focus on extreme readings above 500 or below -500; when price is pressing above 500 and moving towards 1000 there is an expectation that the indexes are also pushing higher (with strong flow) into a big candle.
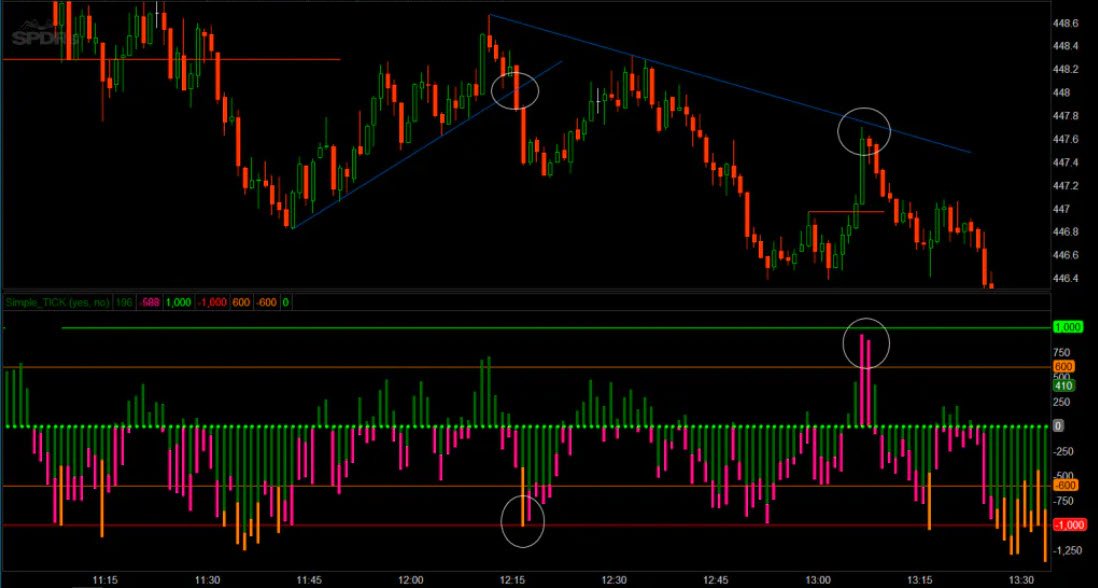
As the TICK hits 1000 we can expect that the stock indexes are about to pause or pull back. The same thing works the other direction as well; if we see TICK breaking lower and pressing into -1000 there is an expectation that the stock indexes are also pressing lower (with strong flow) into a big candle. As the TICK hits -1000 we can expect that the stock indexes are about to pause or pull back
Simple TICK showing $SPY pausing as extreme TICK readings are hit. This picture shows where $SPY began a breakout but stalled as the $TICK readings spiked into -1000 and into 1000
These pictures above have been using TOS custom indicator called “Simple Tick.” This study was designed to eliminate the noise from looking at the $TICK and give clear readings. The indicator is not looking at the market in your chart – it is looking at the NYSE. So it will not matter if you use it to look at $SPY or $AAPL or markets like /ES and /mNQ; the study is going to be looking at the NYSE.
The share link for this “Simple TICK” is http://tos.mx/drJJB1C
If you are unfamiliar with adding custom studies to your TOS platform - please watch this video.
LH or HL
Another pattern or signal from reading $TICK comes in the form of Lower Highs (LH) or Higher Lows (HL); once we print a pivot and begin to move off of that turning point we want to “stick the trade” as long as the $TICK readings continue to show an increasingly higher low (or lower high). Generally speaking – I like to utilize this in intraday swing trades where we run price from one “swing low” to the next “swing high.”
It should be obvious – but I wanted to point out that this study is “capped” and thus will not continue to provide HH and LL signals; for example, the picture above shows where price set a low and began moving off of that “swing low” pivot while the Simple TICK indicator printed higher lows until noon. At that point we see the Simple TICK study print a lower low and SPY presented a “blow off top” and rolled over.
We won’t see the TICK printing 1500, 2000, 2500 and higher (or -1500, -2000, -2500 and lower) because it’s capped at the total number of stocks in the NYSE.
TICK – Review & Summary
We can utilize $TICK as a warning indicator and watch for extreme readings above 1000 or below -1000 to signal a market pause; we can use the $TICK for a continuation signal and stay with the micro-trend as long as the TICK is printing HL (or LH). It takes time to get comfortable with utilizing TICK readings and there are days where TICK is not useful; careful review and analysis of previous signals can provide confidence and understanding.


